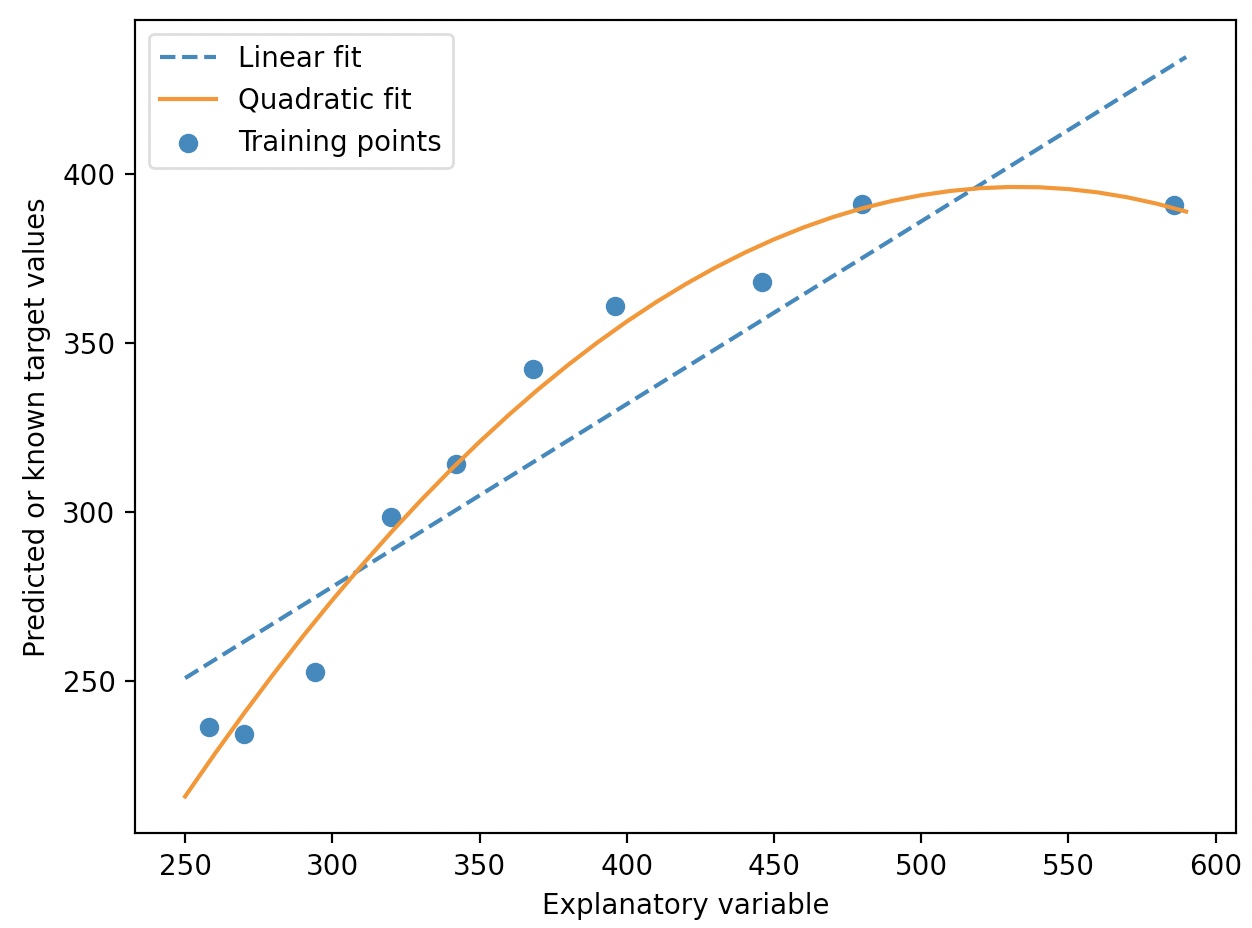
다항 회귀 곡선은 선형 데이터가 아닌 데이터를 다루는 방법으로
기존의 다중 선형 회귀와는 다른 개념이다!
scikit-learn PolynomialFeatures transformer
사이킷런의 PolynomialFeatures 변환기 클래스를 사용하여 특성이 한개이 간단한 회귀 문제에
이차 항(d=2)을 추가할 수 있다.
from sklearn.preprocessing import PolynomialFeatures
X=np.array([258.0, 270.0, 294.0, 320.0, 342.0, 368.0, 396.0, 446.0, 480.0, 586.0])[:,np.newaxis]
y=np.array([236.4, 234.4, 252.8, 298.6, 314.2, 342.2, 360.8, 368.0, 391.2, 390.8])
lr=LinearRegression()
pr=LinearRegression()
quadratic=PolynomialFeatures(degree=2)
X_quad=quadratic.fit_transform(X)
lr.fit(X, y)
X_fit=np.arange(250, 600, 10)[:, np.newaxis]
y_lin_fit=lr.predict(X_fit)
#다항 회귀를 위해 변환된 특성에서 다변량 회귀 모델을 훈련
pr.fit(X_quad, y)
y_quad_fit=pr.predict(quadratic.fit_transform(X_fit))
plt.scatter(X, y, label='Training points')
plt.plot(X_fit, y_lin_fit, label='Linear fit', linestyle='--')
plt.plot(X_fit, y_quad_fit, label='Quadratic fit')
plt.xlabel('Explanatory variable')
plt.ylabel('Predicted or known target values')
plt.legend(loc='upper left')
plt.tight_layout()
plt.show()

위는 하나의 특성을 가진 이차 다항식임을 명심해야 한다.(헷갈리기 쉬움)
pr.fit(X_quad, y)에서 X_quad.shape=(10, 3)이지만, 이는 특성이 세 개가 아닌 x^0, x^1, x^2를 각각 한 행이 포함하고 있는 것임
MSE & R^2
from sklearn.metrics import mean_squared_error, r2_score
y_lin_pred=lr.predict(X)
y_quad_pred=pr.predict(X_quad)
print('훈련 MSE 비교-선형모델: %.3f, 다항모델: %.3f' %(mean_squared_error(y, y_lin_pred), mean_squared_error(y, y_quad_pred)))
print('훈련 R^2 비교-선형모델: %.3f, 다항모델: %.3f' %(r2_score(y, y_lin_pred), r2_score(y, y_quad_pred)))
훈련 MSE 비교-선형모델: 569.780, 다항모델: 61.330
훈련 R^2 비교-선형모델: 0.832, 다항모델: 0.982
다항(2차) 회귀 모델이 선형 모델보다 훨씬 잘 잡아낸다.
PolynomialFeature Regression with housing data set(dimension=2, 3)
from sklearn.linear_model import LinearRegression
from sklearn.preprocessing import PolynomialFeatures
import matplotlib.pyplot as plt
X=df[['LSTAT']].values
y=df['MEDV'].values
regr=LinearRegression()
quadratic=PolynomialFeatures(degree=2)
cubic=PolynomialFeatures(degree=3)
X_quad=quadratic.fit_transform(X)
X_cubic=cubic.fit_transform(X)
X_fit=np.arange(X.min(), X.max(), 1)[:, np.newaxis]
regr=regr.fit(X, y)
y_lin_fit=regr.predict(X_fit)
linear_r2=r2_score(y, regr.predict(X))
regr=regr.fit(X_quad, y)
y_quad_fit=regr.predict(quadratic.fit_transform(X_fit))
quad_r2=r2_score(y, regr.predict(X_quad))
regr=regr.fit(X_cubic, y)
y_cubic_fit=regr.predict(cubic.fit_transform(X_fit))
cubic_r2=r2_score(y, regr.predict(X_cubic))
plt.scatter(X, y, label='training points', color='lightgray')
plt.plot(X_fit, y_lin_fit, label='Linear (d=1), $R^2=%.2f$' %linear_r2, color='blue', lw=2, linestyle=':')
plt.plot(X_fit, y_quad_fit, label='Quadratic (d=2), $R^2=%.2f$' %quad_r2, color='red', lw=2, linestyle='-')
plt.plot(X_fit, y_cubic_fit, label='Cubic (d=3), $R^2=%.2f$' %quad_r2, color='green', lw=2, linestyle='--')
plt.xlabel('% lower status of the population [LSTAT]')
plt.ylabel('Price in $1000s [MEDV]')
plt.legend(loc='upper right')
plt.show()

차수를 증가시키면 계산적으로 특성의 개수가 증가한 것과 유사한 효과가 있다.
다항 특성을 많이 추가할수록 모델 복잡도가 증가하고 과대적합의 가능성이 높아진다.
실전에서는 별도의 테스트 데이터셋을 이용해서 모델의 일반화 성능을 평가하는 것이 좋다.
또한 비선형 관계를 모델링할 때 다항 특성이 최선의 선택이 아닐 수 있다.
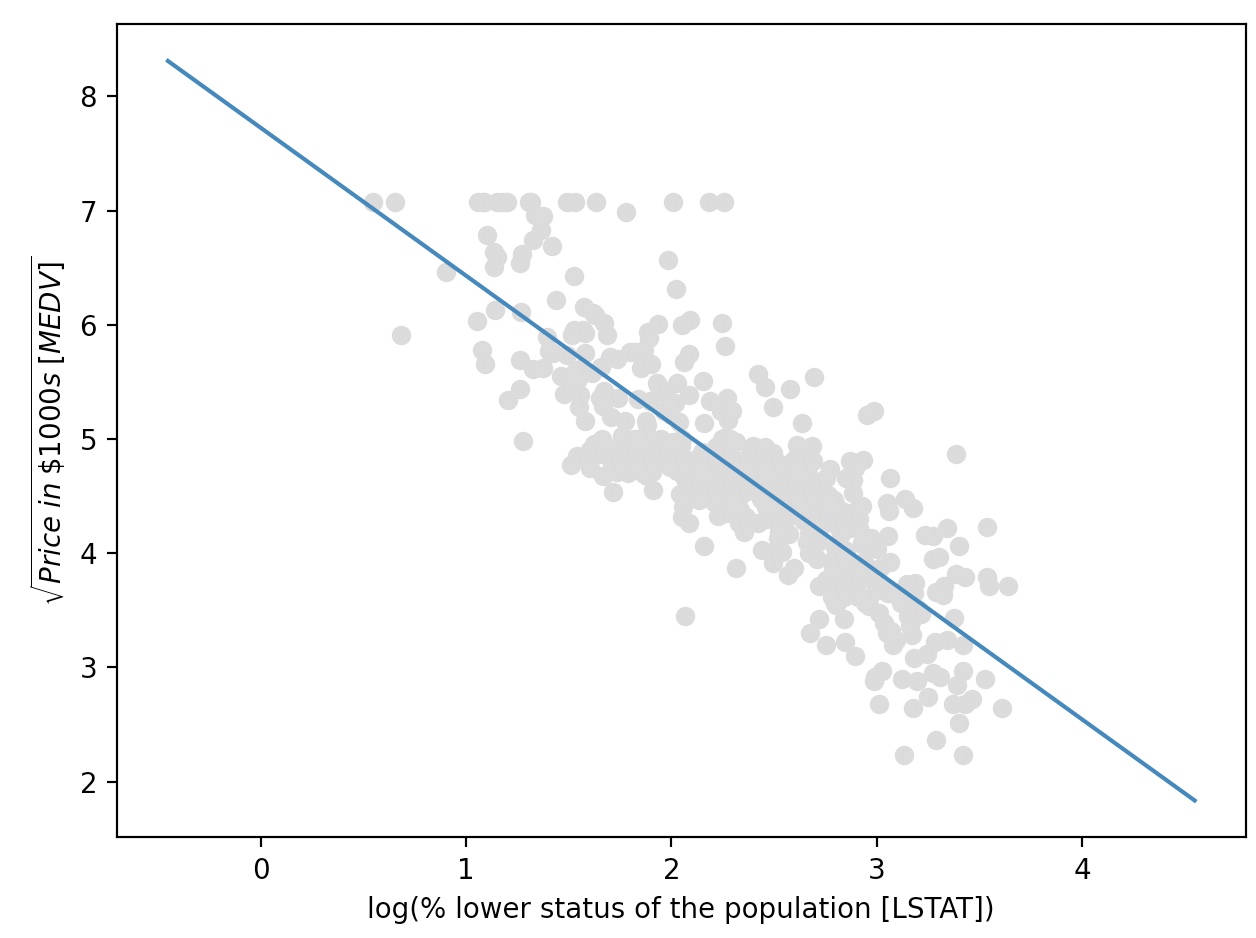
MEDV-LSTAT 산점도를 보면 지수함수와 비슷함을 알 수 있다.
f(x)=e^-x
log( f(x) )=-x
X_log=np.log(X)
y_sqrt=np.sqrt(y)
X_fit=np.arange(X_log.min()-1, X_log.max()+1, 1)[:,np.newaxis]
regr=regr.fit(X_log, y_sqrt)
y_lin_fit=regr.predict(X_fit)
linear_r2=r2_score(y_sqrt, regr.predict(X_log))
plt.scatter(X_log, y_sqrt, label='Training points', color='lightgrey')
plt.plot(X_fit, y_lin_fit, label='linear (d=1), $R^2=%.2f$' %linear_r2)
plt.xlabel('log(% lower status of the population [LSTAT])')
plt.ylabel('$\sqrt{Price \; in \; \$1000s \; [MEDV]}$')
plt.tight_layout()
plt.show()
